
Understanding the properties of golf shafts is critical for club fitters and important for golf coaches looking to improve their students’ performance. This is an overview of the software I created to understand golf shafts by analyzing their measurements. Access to the data is available at Golf Shaft Reviews.
I was introduced to the concept of EI shaft profiling, the measurement of the golf shaft at various points on the shaft, by golf shaft design engineers. Early in my education of club building I was taught to use frequency for measuring shafts. There were no commercially available instruments for taking EI shaft measurements. Some shaft companies used laboratory strain testing equipment. Those were out of my budget as well as beyond the budget of many smaller shaft companies. I set out to make my own instrument and after two years and many designs, I designed and manufactured an EI instrument. It is easy to use, requires no maintenance and is accurate to 0.0001″. It is owned by many of the top club fitters around the world and several shaft companies.
My database contains thousands of shaft measurements. This software is available to golf professionals looking to understand the differences between golf shafts. It provides the perspective of the golf shaft that is commonly used by golf shaft designers. The software has evolved from humble beginnings to an extensive tool for understanding the golf shaft. If you are in the business of providing tour level golf club fittings, or helping your students play better golf this software is an essential tool.
Driver Shaft Overview
Nothing gets more attention in the golf shaft business than the driver shaft. They are offered by companies large and small. The driver shaft section of the Fit2Score software presents views of shaft models, individual shafts and lets you compare different models to each other. The software, written in Excel, starts with a page to compare up to 10 shafts with each other. Seen here is the 2022 Mitsubishi Tensei White 1K driver shaft. It is selected in the top most pull down. All of the shafts in the model are charted. This lets you see if they are all a similar design, differing in stiffness or if different weights are actually different designs. I will explain each section of this page below. This knowledge is used to fit your Driver at Fit2Score.

Ten pull down boxes let you select shafts from the database. They are arranged by manufacturer and model. The check boxes on the left let you use the shaft in the pull down list or default to the next shaft in the database. A single selection in the top box created the page illustrated above.
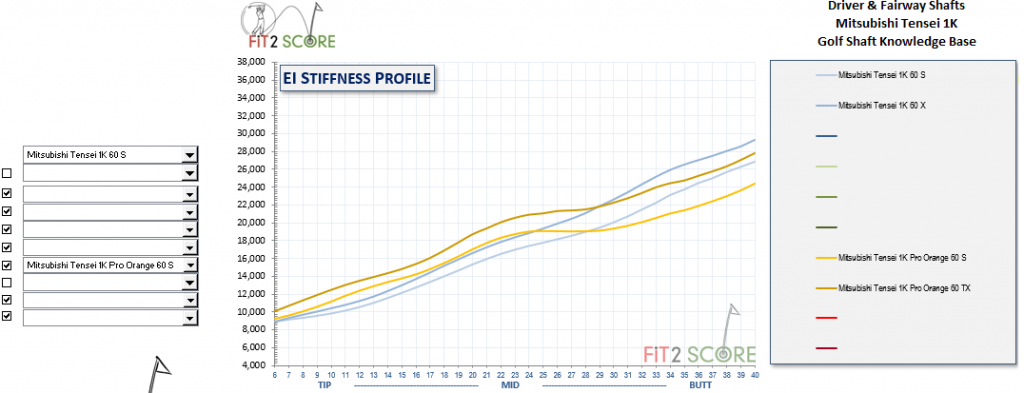
Using the check boxes, individual or groups of shafts can be selected for comparison. Here the Tensei Pro White 1K 60S and 60X are compared to the Tensei Pro Orange 1K 60S and 60X.
The EI Stiffness Profile Change is a unique chart. It displays the change in stiffness down the shaft from point to point. This unique view removes the stiffness and shows a clear image of the change of stiffness. When looking at all the shafts of a model, you can clearly see how shafts in the matrix compare. While the shafts vary in weight and stiffness, they may not all have the same launch signature. The Signature view is an essential tool for understanding the launch propensity and feel of a shaft. Most important, It graphically illustrates consistency through a model. When the shafts in the set do not have similar profiles, a fitter cannot move from weight to weight or stiffness to stiffness knowing that the change is a meaningful variation from the previous shaft.
The torque profile, known as GJ to shaft engineers, shows torque measurements taken in 5″ increments. Hoop deformation measurements are also taken in 5″ steps. Hoop deformation is used to correct EI profiles for the distortion of the shaft caused by the traditional three point process of measuring EI. The three point process, engineering text book system, is used to measure solid beams. Golf shafts, which are hollow tubes, flatten when loaded. Hoop deformation data corrects the EI profile for flattening measurement distortion.
Lower cost shafts, using ‘thicker’ carbon fibers may duplicate the bend profile of the premium shafts, but never the torque and hoop profiles. To achieve low torque, bias and hoop plies must be incorporated into the design. This requires higher cost ‘thinner’ carbon fiber sheets. The torque and hoop properties of shafts cannot be overlooked when comparing shafts.

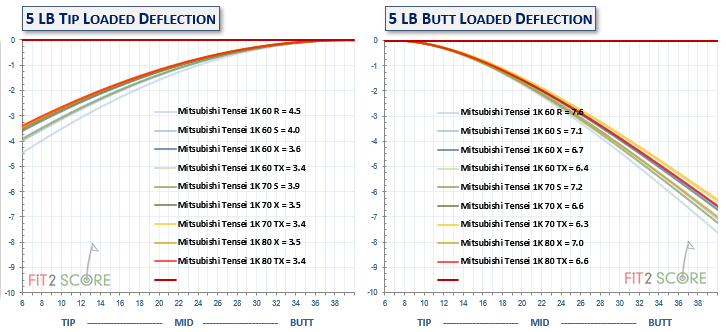
Deflection profiles are calculated from EI data, with formulas from my friend, Dave Tutelman. Deflections boards have been around since the early days of club building. The shaft is clamped at the butt, weighted at the tip and the total bend is measured. My point by point profiles are used to mathematically bend the shafts. Total bend is a classical way to rate shaft stiffness. The total bend numbers are presented in both graphic and table modes, creating a simple overall stiffness rating system.
Ralph Maltby, using the tools available at the time, rated launch propensity of golf shafts by clamping the shaft at the tip and applying weight at the butt. He innovatively used a deflection board backward from its design intent. I included his traditional view of launch propensity in the analytics.
The last element on the page is a table of important shaft values. The traditional method of designating shaft stiffness R, S, X, TX, while useful for designating the stiffness of shafts of a brand model is useless for comparing shafts of different models or different brands.

This table shows the area under the EI curve. The stiffness of each point of a shaft is included in the overall rating of the shaft. It has been validated with tour pro experience as a valid indication of perceived stiffness. You should note that I do not include frequency. Frequency measurements are taken in many different ways with many different weights. More important, frequency only measures the stiffness of the shaft immediately below the frequency clamp. It does not measure the overall stiffness of the shaft. Another way of comparing shaft stiffness is deflection. The easiest way to compare shafts by deflection is to measure the deflection with a load cell. Why this never became a published standard is a profound mystery to me. That is shown as Butt LBS in the table and our database is the only place the public can find it.
All shafts in the database are measured exactly the same way on the same instrument for each of the columns in this table.
Driver Shaft Matching

Knowing how shafts resemble one another are the most valuable pieces of information a shaft profiling system offers the golf professional. With thousands of driver shafts in the system, the matching software makes it easy to find shafts with similar bending profiles. With it, you can find a match to a shaft that works for a golfer. When outfitting a fitting system, you can avoid adding shafts that closely resemble ones you already have. Or, moving forward, when a shaft you like is nearing the end of its product life, you can find newer models that resemble it.
Most often, I use it to locate a shaft in my fitting system that resembles a shaft a golfer wants to try. The matching algorithm locates eight potential matches. The matches are filtered to include only shafts that have closely matched weight and torque. You can choose to see the shafts selected by the system individually or as a group.
Hybrid, Iron and Wedge Shafts
Hybrid, Irons and Wedge shafts are each on a separate page that is much like the drive page described above.
Over the course of measuring countless sets of iron shafts I realized that iron shafts cannot be viewed by looking at a single shaft in the set. On many sets the bend profile of the 3 iron shaft was different than the wedge shaft. Some had the same bend signatures, but many incorporated progressive launch profiles. Some long iron shafts have a propensity to launch higher than the wedge shafts in the set.
The long iron shaft is entered into the Hybrid shaft database. This makes it possible to create a composite view of a set. This illustration shows the composite view of an iron set.
We can see the consistency of the shafts through the set. By comparing the EI stiffness of the 3 iron and the wedge shaft we see the “flighting” of the set. Flighting was introduced by Project X many years ago. It is the range of stiffness through the set. Flighted sets have a greater range, promoting higher launch in the long irons and lower launch in the short irons.
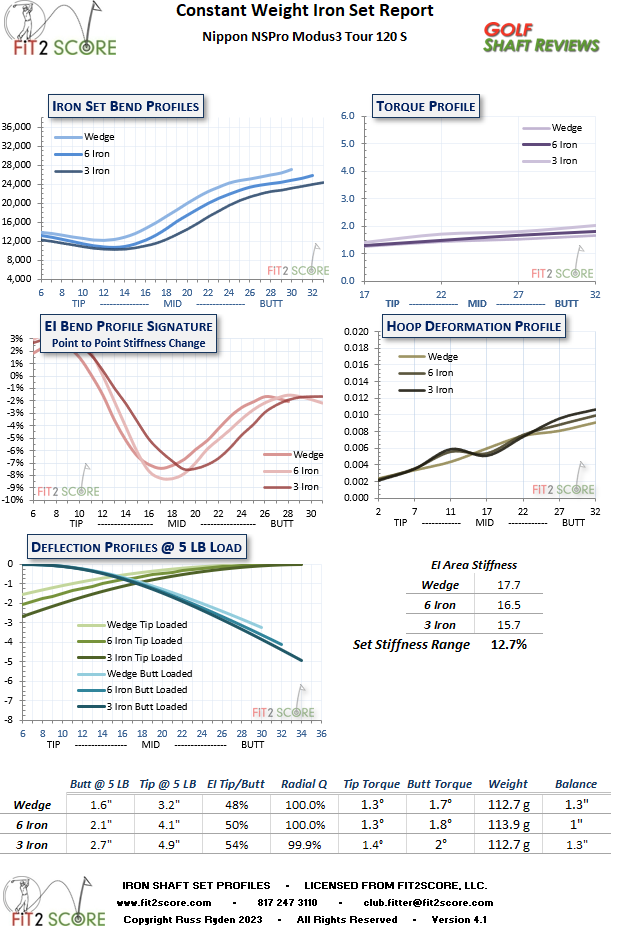
My database is unique in rating set stiffness range of iron sets. This brings a new dimension of understanding to the golf fitter. If you are interested in a subscription to this software contact me at club.fitter@fit2score.com.